Yes, your Shopify reports are a vital component of any winning eCommerce marketing strategy — but without fully understanding and harnessing the power of Shopify advanced reports, you’re missing out. With the right collection of Shopify reports, you are...
Yes, your Shopify reports are a vital component of any winning eCommerce marketing strategy — but without fully understanding and harnessing the power of Shopify advanced reports, you’re missing out.
With the right collection of Shopify reports, you are able to not only gather vital sales data and marketing insights but also discover hidden opportunities to optimize inventory management, marketing, retention, and sales.
But which Shopify reports should you be focusing on?
In this post, we give you the top Shopify reports you should be focusing on. These reports include:
Sales overview Attribution model comparison Sessions attributed to marketing Average order value over time Sales by channel First-time vs. returning customers Sessions over time Online store cart analysis Sales by product ABC analysis by product Fulfillment over time Product orders and returnsWe also provide everything you need to know about Shopify reporting to use these reports to make better business decisions. Decisions that will ultimately help you reduce costs, increase sales, and boost overall profitability.
Let’s jump in!
Table of Contents
Types of Shopify Reports for eCommerce Shopify Reports Available per Plan 12 Must-Use Reports for Shopify Merchants What About Creating a Custom Report on Shopify? Best Practices for Better ReportsTypes of Shopify Reports for eCommerce
Whether it’s optimizing one marketing campaign or reshuffling your entire eCommerce sales funnel, you need access to quality analytics and data before making adjustments.
This is where Shopify reports come in.
However, they offer Shopify merchants far more insights than just marketing campaign performance. Instead, the Shopify admin gives you access to all online store data, so you can make an informed decision when optimizing any part of your business, be it front or backend.
There are 11 main types of Shopify reports — which include sales, customer, retail, and inventory, to name a few. Here is a complete list of reports:
Sales Marketing Acquisition Behavior Customer Finance Fraud Inventory Order Profit Retail salesLet’s take a quick look at each.
1. Sales Reports
From “Total sales” to “Average order value over time,” the Shopify admin offers store owners a host of business sales and Shopify analytics data. There is a lot data and insight from these reports that can be used to assess where revenue is coming from to help you adjust strategies.
Here is a list of some of the possible sales reports you can access from your Shopify dashboard:
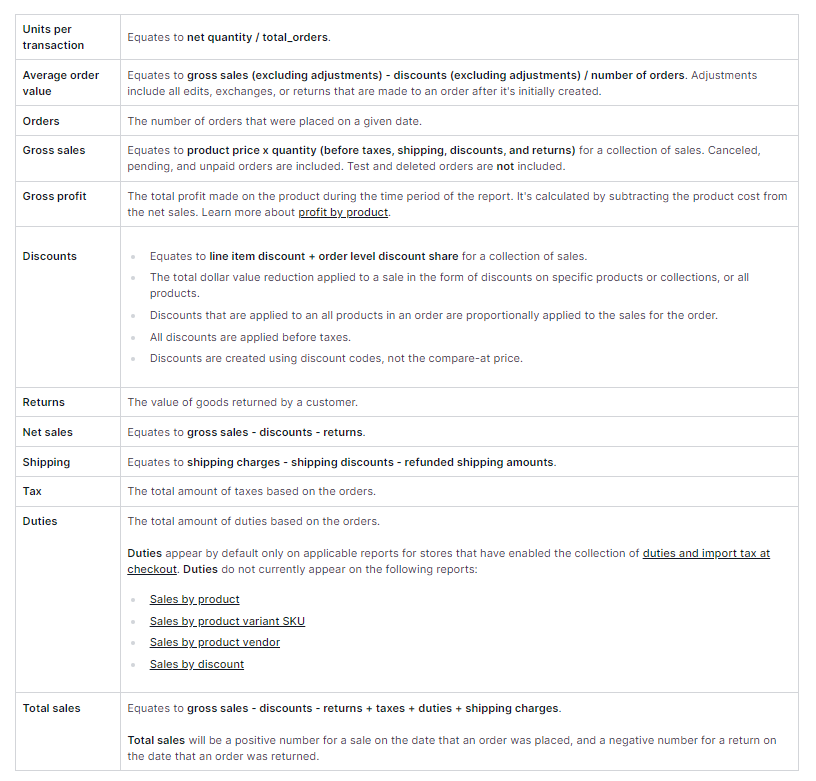
Sales over time Sales by product Sales by product variant SKU Sales by product vendor Sales by discount Sales by traffic referrer Sales by billing location Sales by checkout currency Sales by channel Sales by customer name Average order value over timeTip: New Shopify merchant? Here’s a list of some common terms you will find in your next Shopify sales report.
[Source: Shopify]
Sales Report Access and Important Notes
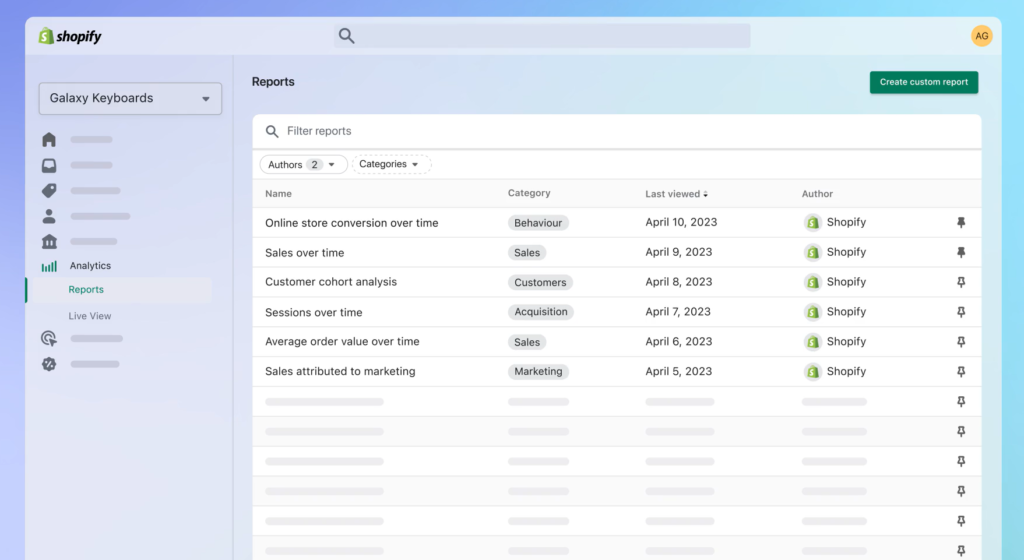
Shopify sales reports are only available to Shopify merchants who are on the Shopify plan or higher. To view these reports, go to Analytics from your Shopify admin (or Shopify app if on mobile) and then click Reports. Then click Categories and then Sales.[Source: Shopify]
2. Marketing Reports
Shopify marketing reports give you the analytics you need to ensure your multi-channel marketing strategy is performing at its peak.
Ultimately, they enable Shopify merchants like yourself to see where your shoppers are coming from and which digital touchpoints or triggers (such as a TikTok video or Google ad) drive them to your product pages to shop.
Here is a list of some of the marketing reports you can access from the Shopify dashboard:
Sales attributed to marketing Sessions attributed to marketing Conversion by first interaction Conversion by last interaction The attribution model comparisonMarketing Reports Access and Important Notes
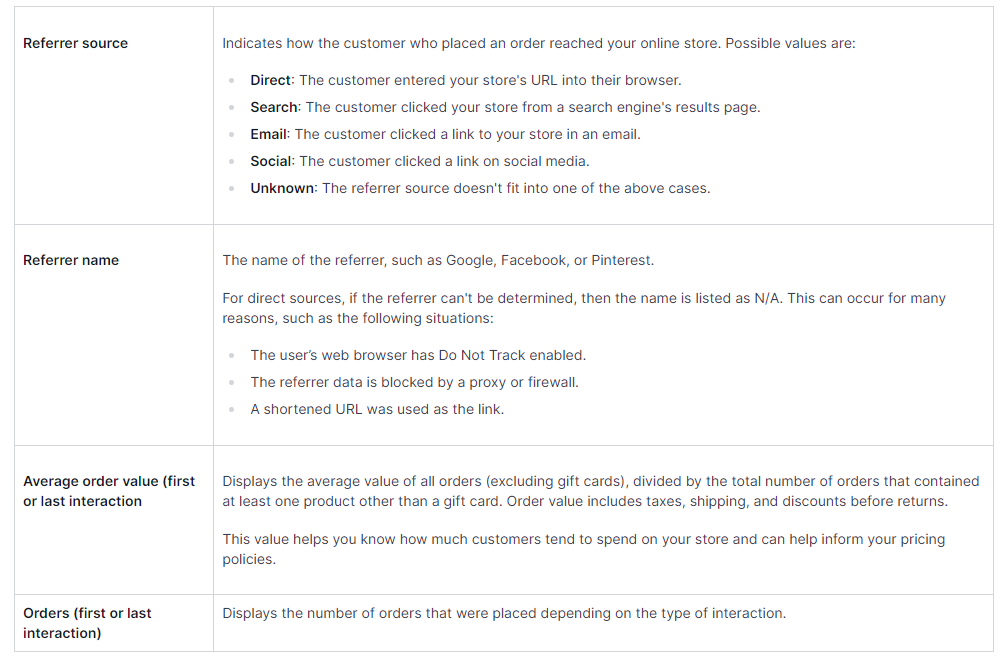
All marketing reports are available from the Shopify plan or higher — except for the “Sessions attributed to marketing” report, which is available if your online store is on the Basic Shopify plan or higher. To view these reports, go to Analytics from your Shopify admin (or Shopify app if on mobile) and then click Reports. Then click Categories and then Marketing.Tip: New Shopify merchant? Here’s a list of some common terms you will find in your marketing reports.
[Source: Shopify]
3. Acquisition Reports
Shopify acquisition reports show how your shoppers (site visitors) come to your store and how long they spend on your store pages. Unlike the “Sales by traffic referrer source” report, the acquisition doesn’t show converted sales or the number of orders.
Here is a list of some of the marketing reports you can access from the Shopify dashboard:
Sessions over time Sessions by referrer Sessions by locationAcquisition Report Access and Important Notes
Acquisition reports apply to the online store sales channel only. To view these reports, go to Analytics from your Shopify admin (or Shopify app if on mobile) and then click Reports. Then click Categories and then Acquisition.4. Behavior Reports
Shopify behavior reports help you understand the shopping behavior of your customers. These reports provide an abundance of data and insights that can help you plan your upsell strategies and product bundles and increase your overall AOVs (average order values).
Here is a list of some of the behavior reports you can access from the Shopify dashboard:
Online store conversion over time Online store speed Online store cart analysis Product recommendation conversions over time Search conversions over time Sessions by landing page Sessions by device Top products with low recommendation click rate Top online store searches Top online store searches with no clicks Top online store searches with no resultsBehavior Report Access and Important Notes
To view these reports, go to Analytics from your Shopify admin (or Shopify app if on mobile) and then click Reports. Then click Categories and then Behavior.Newbie Tip: How to Connect and Import Shopify Data on Google Sheets
To import your Shopify data into Google Sheets, follow these steps:
Create a new spreadsheet, or open an existing one, in Google Sheets. Search for a Shopify connector add-on (in Google Workspace Marketplace), and install it. Follow the add-on’s prompts to authenticate your Shopify account. Choose the specific data you want to be imported into your Google Sheet. Set up automatic data refresh options, if needed, to ensure your sheet stays up to date.Here’s a more detailed video of how to perform these steps.
5. Customer Reports
Customer reports offer valuable insights into your shoppers for you to improve and optimize customer retention. With Shopify’s advanced report options, you can access customer data based on the entire order history of customers.
Here is a list of some of the customer reports you can access from the Shopify dashboard:
Customers over time First-time vs. returning customer sales Customers by location Returning customers One-time customers Customer cohort analysis Predicted spend tierCustomer Reports Access and Important Notes
Complete activity on your store may not be reflected in your customer reports for up to 12 hours. Reports with Shopify Analytics are limited to 250,000 customers. Bigger online stores may need to focus more on Google Analytics for customer data. To view these reports, go to Analytics from your Shopify admin (or Shopify app if on mobile) and then click Reports. Then click Categories and then Customers.6. Finance Reports
Shopify’s financial reports point you and other store owners to important information and data. At the same time, the finances summary page displays an overview of each Shopify merchant’s sales, payments, liabilities, and gross profit data for the selected time frame.
Here is a list of some of the finance reports you can access from the Shopify dashboard:
Finances summary page United States sales tax Sales finance Payments finance Liabilities finance Gift cardsFinancial Report Access and Important Notes
It’s important to note that Sales and Payment finance reports could display different numbers. This is because the Sales finance report includes specific order information, whereas Payments include specific payment information. Additionally, there are cases where orders are placed at a different time to when a payment is received. To view these reports, go to Analytics from your Shopify Admin (or Shopify app if on mobile) and then click Reports. Then click FCategory and then Finances.7. Fraud Reports
Fraud reports are related to identifying and managing fraudulent transactions and activities that directly impact sales and the operational aspects of your retail business. Or, as Shopify phrases it: “A month-end snapshot of your inventory to help you track the quantity and percentage of inventory sold per day.”
Here is a list of some of the fraud reports you can access from the Shopify dashboard:
Acceptance rate Fraudulent chargeback rate Fraudulent chargeback value High-risk orders rate Orders canceled due to fraud Overall chargeback rate Shopify Protect dispute total Shopify Protect order totalFraud Report Access and Important Notes
All fraud reports are available to online stores with any Shopify subscription and cannot be customized. To view these reports, go to Analytics from your Shopify admin (or Shopify app if on mobile) and then click Reports. Then click Category and then Fraud.8. Inventory Reports
Shopify inventory reports help store owners manage and track inventory levels, make informed decisions regarding restocking, and optimize their inventory management processes. Or, as Shopify phrases it: “A month-end snapshot of your inventory to help you track the quantity and percentage of inventory sold per day.”
Here is a list of some of the fraud reports you can access from the Shopify dashboard:
Month-end inventory snapshot Month-end inventory value Average inventory sold per day Percent of inventory sold ABC analysis by product Product sell-through rate Days of inventory remainingInventory Report Access and Important Notes
To view these reports, go to Analytics from your Shopify admin (or Shopify app if on mobile) and then click Reports. Then click Categories and then Inventory.9. Order Reports
Shopify Order reports provide insight and data into your order volume, fulfillment strategies, shipping, delivery, and returns.
Here is a list of some of the order reports you can access from the Shopify dashboard:
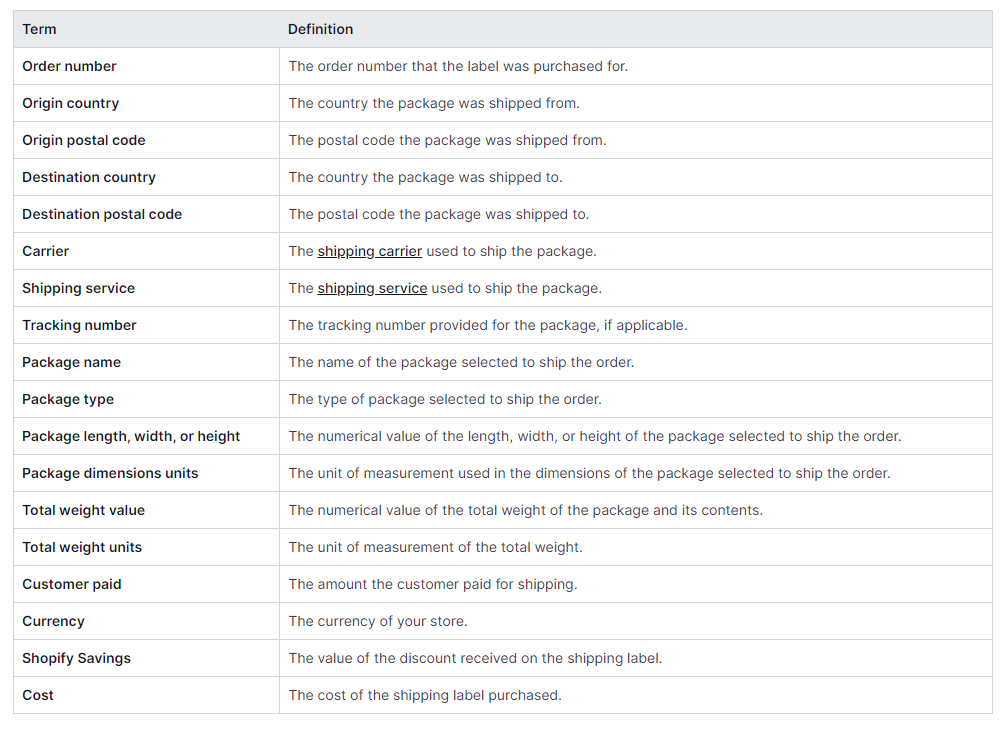
Product orders and returns Orders over time Fulfillment, shipping, and delivery times Fulfillment over time Shipping labels over time Shipping labelsTip: New Shopify merchant? Here’s a list of some common terms you will find in your shipping label order reports.
[Source: Shopify]
Order Report Access and Important Notes
To view these reports, go to Analytics from your Shopify admin (or Shopify app if on mobile) and then click Reports. Then click Categories and then Orders.10. Profit Reports
Shopify offers merchants a few reports that online store owners can use to determine where their store is in terms of earnings. At the end of the day, these profit reports will give you access to good analytics that you can use to make informed financial decisions and assess the profitability of your product and brand.
Here is a list of some of the profit reports you can access from the Shopify dashboard:
Profit by product Profit by product variant SKU Profit by Point of Sale location Discounts and refundsProfit Report Access and Important Notes
To view these reports, go to Analytics from your Shopify admin (or Shopify app if on mobile) and then click Reports. Then click Categories and then Profit margin.11. Retail Sales Reports
Shopify retail sales reports enable brick-and-mortar or omni-stores to see offsite data analytics. This includes information about customers’ point-of-sale orders based on criteria such as product, SKU, or staff.
Here is a list of some of the retail sales reports you can access from the Shopify dashboard:
Retail sales Retail sales by product Retail sales by location Retail sales by staff Retail sales by discount Retail sales by hour of the day Retail sales by custom salesRetail Sales Reports Access and Important Notes
Retail sales reports can be accessed by stores on the Shopify plan or higher. To view these reports, go to Analytics from your Shopify admin (or Shopify app if on mobile) and then click Reports. Then click Categories and then Retail sales.Shopify Reports Available per Plan
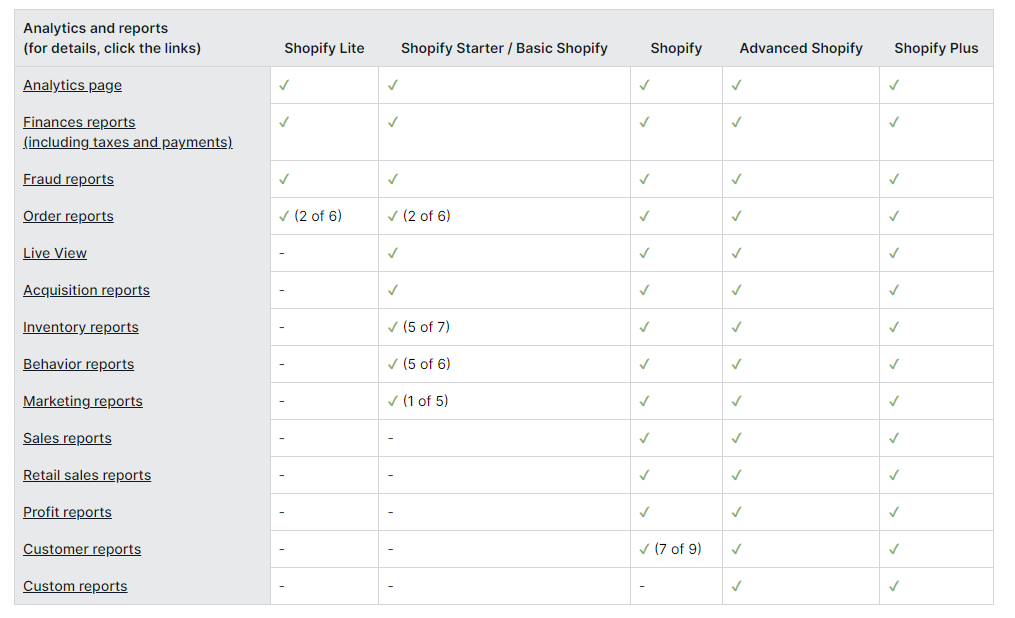
Let’s quickly recap which Shopify reports are in your plan.
[Source: Shopify]
12 Must-Use Reports for Shopify Merchants
Now we know which type of Shopify reports you have access to and what data and insights they offer. So, let’s look at the 12 must-use reports you should be regularly assessing. These include the following reports:
Sales overview Attribution model comparison Sessions attributed to marketing Average order value over time Sales by channel First-time vs. returning customers Sessions over time Online store cart analysis Sales by product ABC analysis by product Fulfillment over time Product orders and returnsShopify Report #1: Sales Over Time
Keeping a close eye on the number of orders and the total number of sales your store has done over a period of time is vital.
Not only does it give you the opportunity to compare revenue to expenses (to assess profitability), but it enables you to compare sales and orders year-on-year at various times. This is essential if you want to track eCommerce trends, identify seasonal products, and measure the impact of marketing campaigns and promotions.
[Source: Coupler]
Ultimately, this Shopify report will help you make better data-driven decisions and optimize various business elements, including inventory management and promotion strategies.
Shopify Report #2: Attribution Model Comparison
This advanced Shopify report compares the number of orders and average order value between the first and last interactions. The attribution model comparison will show you a snapshot of the AOVs between the conversion by first interaction and conversion by last interaction reports.
But, as we know, eCommerce attribution modeling is a tricky thing — we can’t rely entirely on one report. You will also want to use it in conjunction with Shopify’s Channel Performance report to ensure you have a complete, in-depth insight into your customers’ journey to conversion.
[Source: Shopify]
Shopify Report #3: Sessions Attributed to Marketing
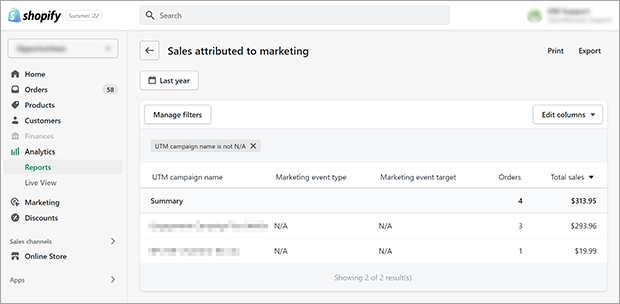
The “Sessions attributed to marketing” report is an important data source to ensure your marketing strategy campaigns are performing at their optimum. (Unless you are using automated PPC management services like Traffic Booster, of course!)
Bonus Content: PPC Management Software and Automation for eCommerce
This Shopify Analytics report offers shop owners real-time insights, with data updated every few seconds.
[Source: Shopify]
Shopify Report #4: Average Order Value Over Time
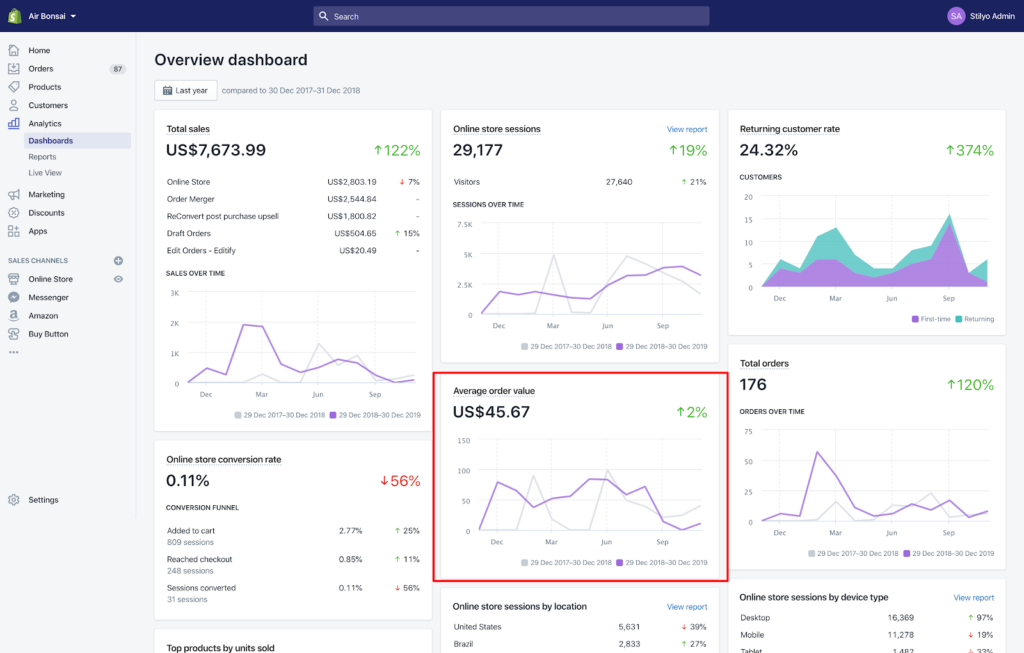
The “Average order value (AOV) over time” is a Shopify sales report that shows how the average order values of your store have changed over time.
[Source: Digismoothie]
By monitoring AOV trends, you can adjust pricing, marketing campaigns, and inventory management strategies to enhance your eCommerce business’s profitability and customer engagement.
Why?
This Shopify dashboard report is essential for tracking your store’s performance, pricing strategies, and marketing effectiveness. Thanks to the customer spending insights it provides, you can better optimize revenue based on sound data.
Shopify Report #5: Sales by Channel
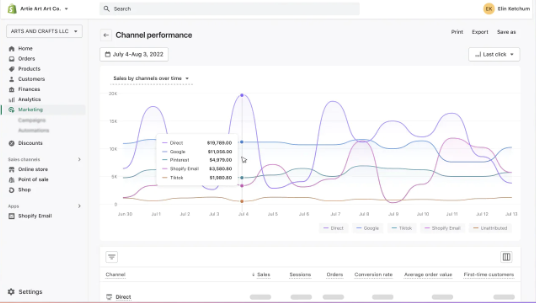
Another critical Shopify report to pay close attention to is “Sales by channel.” Knowing exactly where each sale originated is vital if you want to ensure your marketing strategy is working well.
This is becoming increasingly important as new selling channels such as TikTok Shop or Instagram Shopping start to dominate. You also may want to consider using these reports and analytics in conjunction with a Shopify reporting app — even better if combined with AI.
Bonus Content: AI for eCommerce: The Ultimate Guide
Shopify Report #6: First-Time vs. Returning Customers
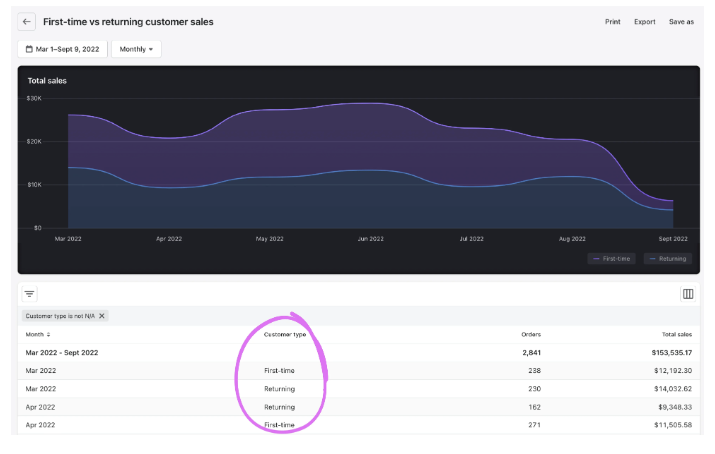
One of the best Shopify reports for deep insights into retention analytics is your “First-time vs. returning customers” report.
This report displays data based on hour, day, week, month, quarter, year, hour of day, day of week, or month of year. For each of these time units, you can find the number of orders placed by each group of customers and the value of orders (total sales) placed by each.
[Source: Shopify]
Shopify Report #7: Sessions Over Time
For successful marketing and profitability, you will want to track acquisition channels and customer sources to understand where your most valuable customers are coming from and allocate marketing resources accordingly.
This report will help you do just that.
The “Sessions over time” report shows you the number of store visitors and the number of sessions within a designated time frame. It is a vital report that forms part of your customer acquisition Shopify Analytics data.
Important Note: Shopify needs time to weed out unwanted bot data, so for best results, allow 48 hours before closely reviewing your traffic data report.
Bonus Content: The Biggest Analytics Lies and How to Spot Them
Shopify Report #8: Online Store Cart Analysis
The “Online store cart analysis” is an advanced report available to Shopify merchants on the Shopify plan or higher. This report offers excellent insights into your shoppers’ store behavior by showing you products that have been added to the cart over the last month.
This report is super handy, as it can provide insights into which products customers are adding to carts together, which you can use to drive upsell or cross-sell strategies.
This data can also help you determine why certain products, when analyzed with cart abandonment rates, are more/less likely to remain in the cart.
Shopify Report #9: Sales by Product
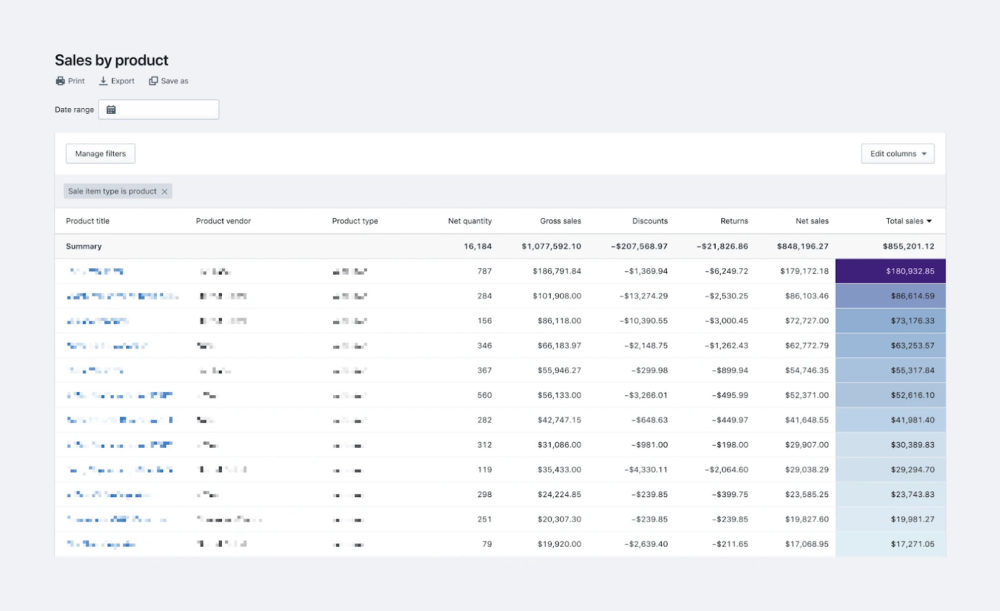
The “Sales by product” report is a great indicator of product performance. It helps you gather important data on which of your products are best-sellers and which will need a promotion to move, and helps you determine which product trends you can use to reframe marketing for slow-moving items.
[Source: Databox]
This advanced Shopify report is one of the more detailed sales reports, giving you a breakdown of the total sales (in dollar amounts) per product. It’s important to note that totals exclude shipping revenue. Therefore, the tax in these reports is minus the shipping fees.
You can expect to see these sales terms on this report:
Product vendor Product type Product title New quantity (of sold items)Shopify Report #10: ABC Analysis by Product
For those merchants on the Shopify plan or higher, it’s worth diving into the “ABC analysis by product” report. This report will grade each of the products based on the percentage of revenue it brought in — giving you a quick snapshot of product performance, which you can use as a starting point for a deeper dive.
Here’s how Shopify defines each grade:
A-grade. These are your top-selling products that collectively account for 80% of your revenue. B-grade. These are your products that collectively account for the next 15% of your revenue. C-grade. These are your products that collectively account for the last 5% of your revenue.Then the following columns are in the ABC analysis by product report.
[Source: Shopify]
Shopify Report #11: Fulfillment Over Time
The next important Shopify report to keep a close eye on is the “Fulfillment over time.” This report will ensure you always know the total number of orders you have fulfilled, shipped, or delivered within any given time.
Ultimately, this report will give you good data you can use to track fulfillment efficiency, monitor order processing times, and identify potential bottlenecks in your operations.
All of which you can then use to streamline your fulfillment processes, improve customer satisfaction, and ultimately enhance the overall efficiency and performance of your eCommerce business.
Shopify Report #12: Product Orders and Returns
Lastly, you want to also track this inventory report for refunds, and returns. By analyzing refund and return trends, you can identify potential product or quality issues, improve customer service, and minimize returns.
When you add this data to product order insights, you can compare best-sellers with those that are returned often to look for overlap — which is why the “Product orders and returns” report is so handy.
This report shows you the total amount of products ordered within a selected time frame, and how many have been returned. Here’s a list of the data it shows.
[Source: Shopify]
What About Creating a Custom Report on Shopify?
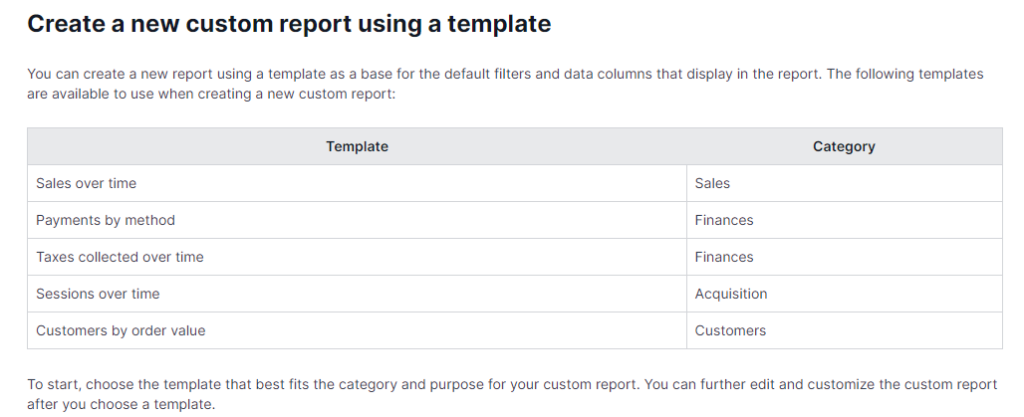
For those Shopify merchants who are on an advanced Shopify or Shopify Plus plan, you have the ability to alter Shopify reports to suit specific data needs. These tailored reports employ flexible filters and customizable columns, allowing you to view data that suits your requirements. You can do this with Shopify’s filtering and editing features.
You can learn more about how to create a custom Shopify report here.
Best Practices for Better Reports
Integrate Shopify Analytics with other reporting apps and tools, such as Google Analytics, for more comprehensive data and insights. Segment your data and insights into customer, channel, or product groups for more advanced reporting insights. Ensure your data entry is consistent and accurate to maintain reliable reports. Guarantee accuracy by manually validating and reconciling data from time to time. Set up notifications for important data thresholds. Customize reports (for advanced Shopify users) so that they focus on KPIs and metrics relevant to your specific online store.Bonus Content: 9+ Must-Track eCommerce KPIs to Ensure Google Ads Success
Final Thoughts: Prioritize Your KPIs When Fine-Tuning Your Shopify Reporting Strategy
There you have it, 12 must-use reports for Shopify merchants. However, from “easy” to more advanced reports, all data is valuable; you just need to ensure you’re looking at the correct data. In other words, with any Shopify reporting list, there is always room for tweaking.
Why?
Because you always need to make sure you’re assessing the most relevant reports for your specific goals.
Additionally, whether you’re on the basic Shopify plan or have a booming Shopify Plus brand, you will also be limited by the type of Shopify store you have.
The post 12 Must-Use Reports for Shopify Merchants: Everything You Need to Know appeared first on .


