Reading Time: 6 minutes As Amazon changes, so too must your sales strategies. But thanks to 10 simple sales metrics and 20 of our must-try tips, you’ll soon be mastering Amazon sales analysis and making the right decisions for...

As Amazon changes, so too must your sales strategies. But thanks to 10 simple sales metrics and 20 of our must-try tips, you’ll soon be mastering Amazon sales analysis and making the right decisions for sustainable growth.
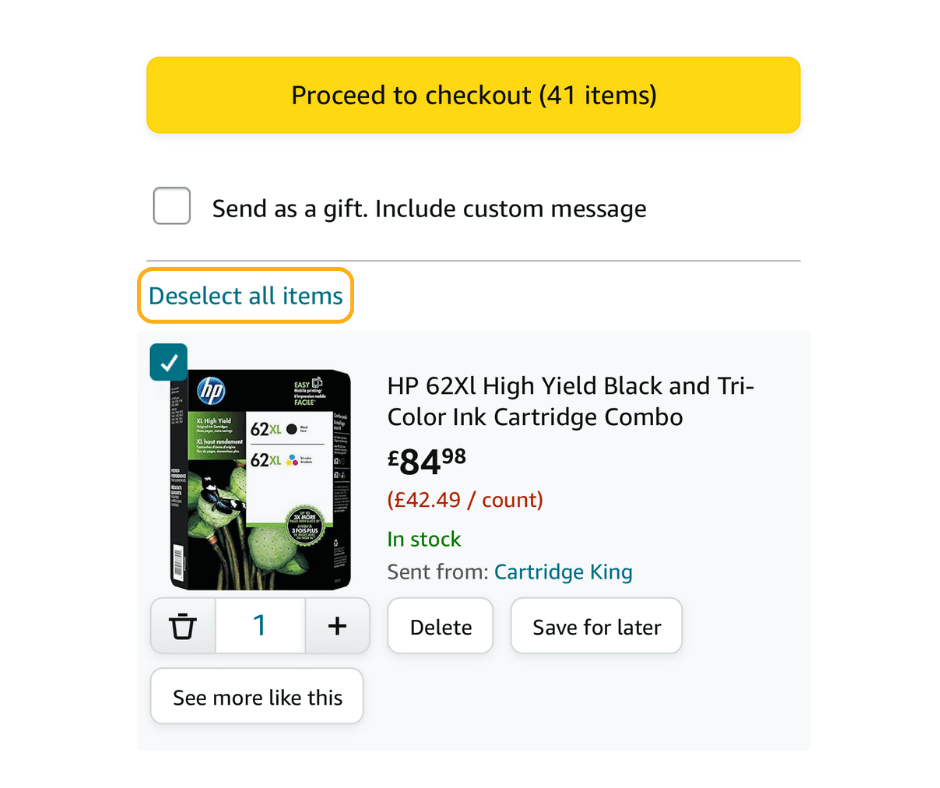
Amazon is a dynamic e-commerce platform. Change happens all the time; sometimes, with sweeping consequences. For instance, new checkboxes in the Amazon app could change the way people shop, tilting the scales in favor of mobile devices, rather than desktops.
Mobile shoppers can now (de)select items individually or in bulk during checkout. They don’t need to switch to their laptops whenever they want to compare and take items out of their cart. Also, since they can check out faster now, opting for the Buy Box isn’t all that alluring anymore.

With the same functionality as the desktop version, this new mobile version could lower cart abandonment. It could also make Amazon a more level playing field. But it also means sellers can’t rely on Buy Box ownership alone to improve sales anymore. So, what can you do to boost yours?
In e-commerce, data reigns supreme. So, Amazon sales analysis is the foundation for developing sales strategies, data-driven marketing campaigns, and sales optimization initiatives. As a seller trying to navigate this minefield called Amazon, it all comes down to examining 10 key metrics.
Decoding the Data: 10 Amazon Sales Metrics for Success
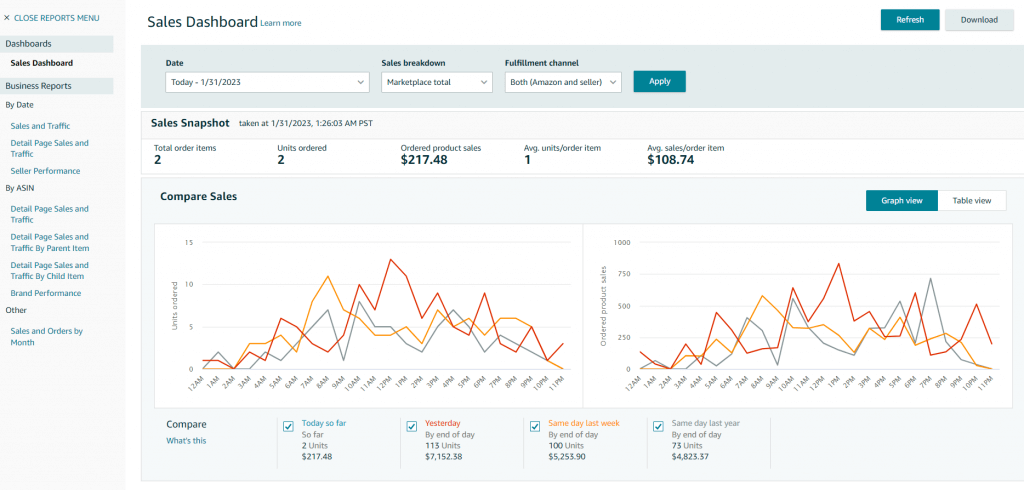
You’ll find all the sales metrics you need in Seller Central. In fact, the 3 most important ones are available in the default view of your Reports menu, the Sales Dashboard. It displays a snapshot of your FBA, MFN, Business, and private sales for your chosen day, with hourly updates.

Units ordered. This sales volume metric reveals the demand for your inventory items. The dashboard displays this as a daily total. But it also shows up as an hourly value on a graph, which is compared to the day, week, and year prior. This reveals buyer shopping habits and the best time to run promotions.
Ordered product sales. This is Amazon speak for ‘revenue’. You’d do well to analyze this graph, so that you can assess your pricing strategies. It shows you when buyers tend to spend more, when they are less active, when you can afford to raise your prices, and when to focus on cutting prices.
Average sales/order item. The equivalent of Average Order Value (AOV), this metric paints a picture of customer spending. Knowing how much consumers are willing to spend per order now (as opposed to the same day last week/year) can indicate the need for price optimization, product bundling, and new marketing initiatives.
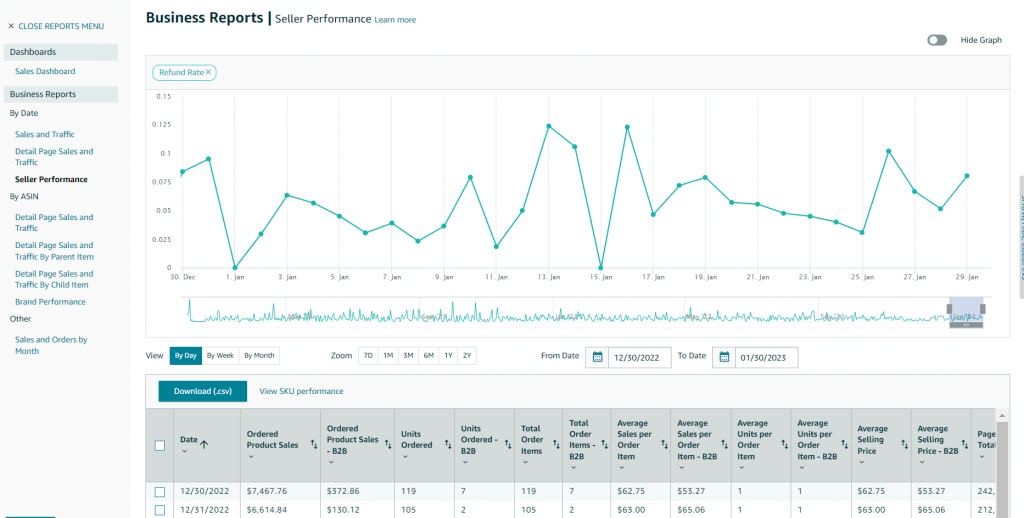
To identify seasonal sales patterns, you can use the Seller Performance report. It shows you the 3 metrics above as well as the performance of individual SKUs. You can also use it to view how many refunds, claims, and negative customer testimonials you’ve received in your chosen time frame.

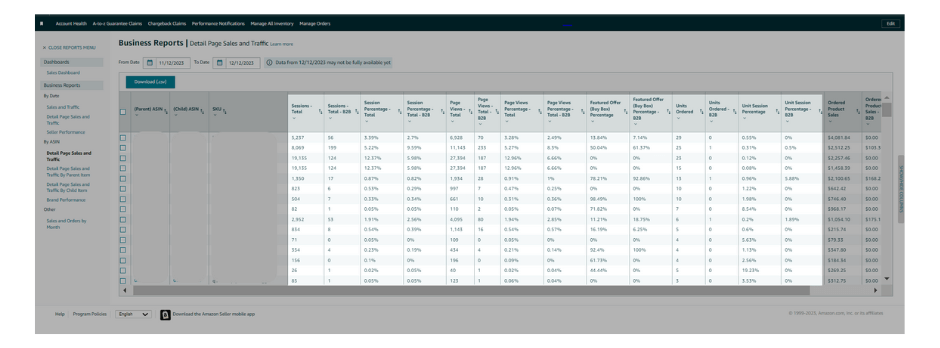
While useful, the metrics above don’t paint the whole picture. Before you can start working on your Amazon sales strategies, you also need to know what makes people come to your page and how you can convert them quickly. That’s what the Detail Page Sales and Traffic report is for.

Page Views. This metric counts the number of visits- including repeat visits- your listing received in the chosen time frame. The higher it is, the higher your rankings and your chances of selling. But if it’s too high for the number of orders you receive, it could indicate that you need to optimize the listing.
Session Percentage. This is the percentage of times a customer buys a product after viewing your offer. However many times they visit the page and however many units in their order, sessions and purchases only count once. Think of it as your conversion rate- an indicator of how competitive your offer is. If it’s under 10%, people are put off by the price, description, features, or some other listing issue.
Unit Session Percentage. Unit Session Percentage Rate counts total units sold from the total number of sessions. It’s essentially a per-unit conversion rate. As it includes mobile conversions, you should aim for a USP of 10%-15%. A low USP means that not many visitors go through with an order, so consider offering coupons that buyers can clip when they compare items and budgets in their cart.
Featured Offer Percentage. Also known as Buy Box Percentage or Buy Box Wins, it shows the number of times you owned the Buy Box when customers viewed your active listing, divided by the total number of page visits over a given time. It shows how good you are at winning the Buy Box when it matters most.
As explained in the tutorial below, the number of page views and sessions your listing attracts can indicate not only how relevant or convincing your offer is, but also whether your product is more suitable for a different fulfillment method.
If you’re considering one of the many types of Amazon ads currently available, you should know that there are a few other sales and traffic metrics that are exclusive to advertisers. These help you gauge a buyer’s level of engagement and find new ways to boost it.
Click-Through Rate. A product listing’s CTR measures effectiveness and rankings. To boost it, you can try tweaking your listing, testing different headlines, and using a variety of keywords, as explained in this Amazon Seller University tutorial.
Customer Acquisition Cost (CAC). This tells you how much you spend on marketing to acquire a new customer. There’s no metric for this in Seller Central, but you can work it out yourself. Simply divide your total sales and marketing expenses by the number of new customers you have over a given time.
Customer Lifetime Value (CLV). This tells you how valuable a buyer is to you, and especially what they would be worth as a repeat customer. You may even identify patterns based on customer demographics, and rethink your customer satisfaction and retention strategy based on this data.
20 Tips for Amazon Sales Optimization
Amazon sales metrics can help you make data-driven decisions for the benefit of your business. With all this valuable insight, you can develop your Amazon sales strategies to achieve sustainable growth. Here are some of the ways you can put this data to good use in your Amazon sales optimization initiatives:
Create compelling product listings with clear, concise descriptions, high-quality images, and accurate product information. Optimize keywords to improve search visibility and attract relevant customers.Identify the search terms that drive traffic to your product listings and target high-volume search queries.Use Amazon ads to increase product visibility and drive targeted traffic.Prioritize customer satisfaction and loyalty with prompt resolutions and a spotless reputation. Attract new buyers with seasonal promotions, limited-time discounts, and bundle offers.Monitor inventory levels to avoid stockouts, minimize overage fees, run ads, keep the Buy Box, and streamline delivery.Check for seasonality and virality before resupplying for a sales season. Address product quality issues that may lead to higher return rates. Build strong relationships with vendors and suppliers to ensure timely product delivery, consistent quality, and competitive pricing.Monitor competitor pricing, product offerings, and marketing strategies to identify opportunities for differentiation and gain a competitive edge. If your page views are low, consider offering coupons and running ads.Use an automatic pricing tool like BuyBoxBuddy to optimize prices.Review your sales regularly to identify trends and anticipate spikes in demand (e.g., Prime Day).Review your performance, account health, and feedback often. Regularly download reports, as they don’t display any data that is more than 2 years old. Bookmark the report pages you use most often in your browser.Paste your favorite URLs in your personal notes and files. Customize time frames and columns for each report to suit your business. Regularly review and analyze sales data to identify trends and adapt your Amazon sales strategies.
So it is that we conclude today’s report on Amazon sales metrics and the myriad ways sales analysis can improve your business decisions. For more tips on ways to secure your Amazon seller success, please follow our blog, where we’ll soon be discussing the amazing features of our software suite.

Melanie takes an active interest in all things Amazon. She keeps an eye on the latest developments and keeps Amazon sellers up to speed.
The post Amazon Sales Strategies for Market Domination appeared first on SellerEngine.


