“Data is gold,” you say? Well not quite. Until you mine gold out of the ground, it’s just dirt. And even after you mine it, it’s still just ore. To get to the gold, you need the right processes,...
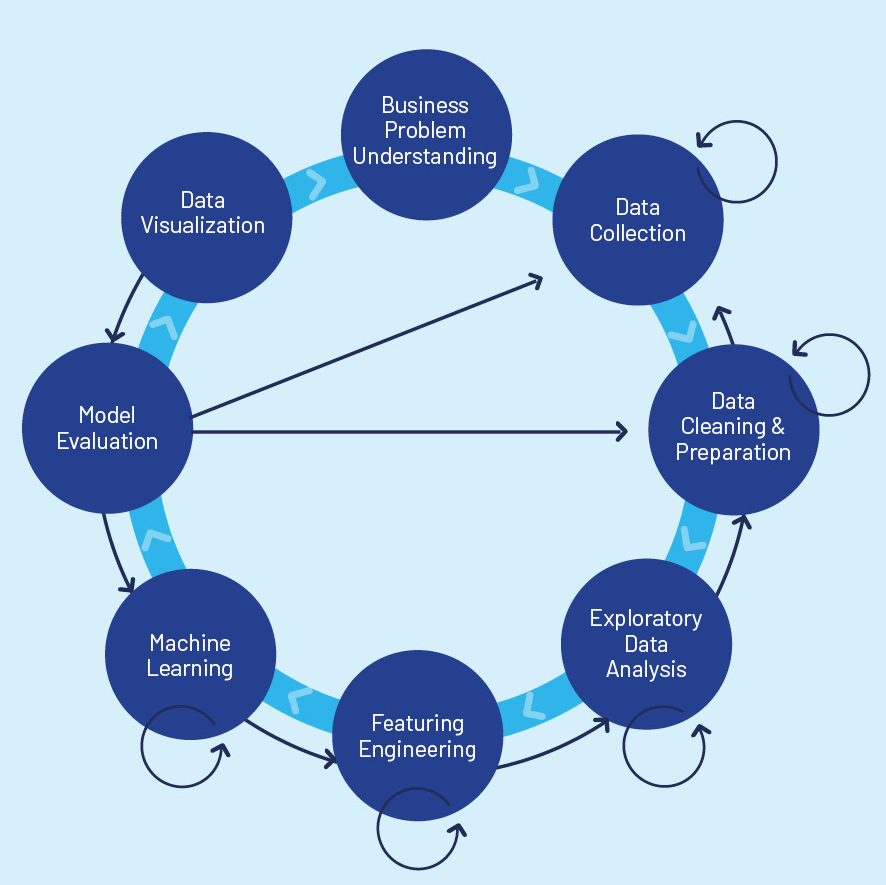
“Data is gold,” you say? Well not quite. Until you mine gold out of the ground, it’s just dirt. And even after you mine it, it’s still just ore. To get to the gold, you need the right processes, chemicals, and machinery. That’s exactly how it works with mobility data. There’s loads of it, just waiting to be mined from mobile devices, connected vehicles, and any number of mobility data sources. And only after you put all that data through the right machinery, it turns into gold – mobility intelligence. This blog is about the machinery that turns mobility data into mobility intelligence, and how it’s all based on the rigorous methodologies of data science.

The Mobility Intelligence Life Cycle
Answering the Most Burning Questions for Smart Mobility Players
Insights are only intelligent if they answer the right questions. That’s why the first step in Otonomo’s mobility intelligence life cycle is about understanding what insights decision makers need to solve modern day mobility challenges. It boils down to two main questions: “where is the demand?” and “who is demanding the service?” But there are differences to what those questions really mean depending on who is asking.
If you operate EV charging stations, you need to know where demand for EV charging is going to be highest, and what the right mix of chargers is at each of those high-demand locations. Mobility-as-a-Service (MaaS) operators, such as micromobility vendors, are looking for the best locations for e-bike or e-scooter rentals. They need to understand how proximity of things like bus or train stations, offices, and cafés or restaurants will affect the demand for electric, two-wheeled transport. And urban planners must understand how to allocate expensive and scarce city resources to deploy mobility stations and transportation networks. They need to understand the visitation needs for different locations to determine the right mix of transportation types that will best serve riders and drivers in the city.
The Machinery of Mobility Intelligence
Let’s look at examples of demand discovery questions:
EV charging operator: Where should I spend $650,000 to set up my next EV charging station in the city, and how many AC and DC chargers should I place there?
e-bike operator: I want to expand my service to another city. How should I prioritize my first 20 bike stations there, and how many docking points should I include in each?
Urban planner: I’ve got EV charging operators and micromobility operators on my back wanting to expand their services to maximize their profits – but I’m more concerned with ensuring my city-dwellers can get around as easily as possible. What sites in the city should I allocate for these services?
Answering those burning questions is an extremely complex process. We need to come up with the best answers through a formula in the following format:
Demand = f(X1, X2, … Xn)
In data science, “Demand” is known as the “label” and parameters X1, X2, … Xn are known as “features.”
Before we even start figuring out the formula, we need to make sure the data we are using is cleaned of outliers or errors and enriched to ensure that all data points are complete and coherent (if the GPS coordinates of a shopping mall place it in the middle of a lake, we’d question the validity of that data point).
Once we have confidence in our core data, we can start building the formula. We need to figure out which features affect demand, and the relationship between the different features. A typical workflow will start with a minimal set of features in a simplistic relationship model. We then apply the model to a known data set and see how accurately the model predicts demand. In early stages, we will usually be way off, and must evaluate how to change the feature set, or the model to improve predictions. This is where the data science behind mobility intelligence becomes somewhat of an art because there’s no “one size fits all” in mobility intelligence. Predicting demand for EV charging stations is quite different from predicting demand for e-scooters. Moreover, the demand model for EV charging in one region may be different from the corresponding model in another region. In practice, demand models may involve dozens of features assembled from many different data sources and assembled into complex formulae. And to complicate the process even more, you can only be sure a model is valid at the time it was formulated. As the world evolves and parameters change, machine learning models that predict demand or any other label must be re-evaluated periodically to ensure they can continue to make accurate predictions.
Finally, we’ll arrive at a demand model that has an acceptably low degree of error when applied to our known data set. The model will typically be much more complex than what we started with.
Seeing is believing
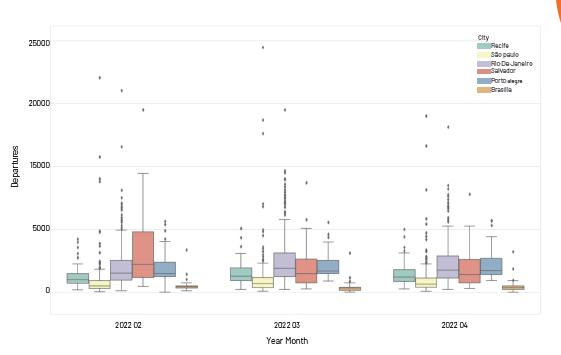
All that data processing I’ve described so far is great, but numbers are only for machines. Our machine learning algorithms can work directly with data, but both data scientists and mere mortals alike need visualization. While data visualization is displayed as the last step in the cycle, it is actually used at nearly every step of the cycle. Using visualizations like scatter plots and histograms Otonomo’s data scientists can quickly detect issues such as errors in data and outliers that might skew predictions. A box plot is particularly useful since it teaches us about the distribution of data and also highlights outliers in one view.

Box plot of departures from cities in Brazil.
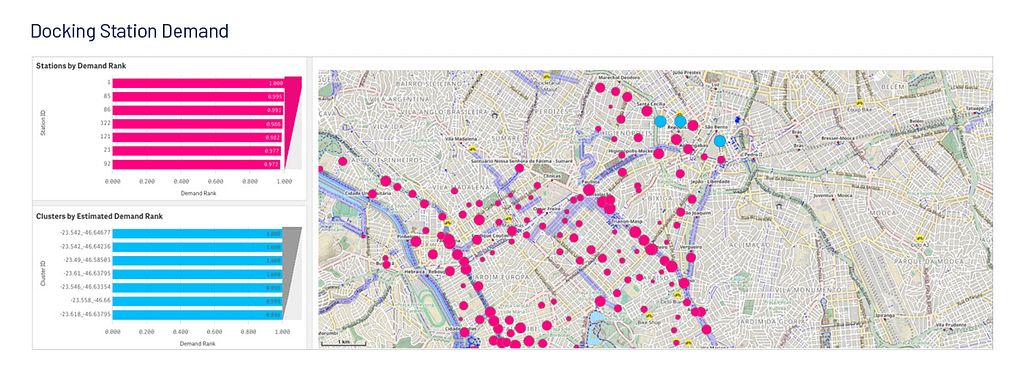
But the most interesting visualizations are ones that answer those burning questions mobility players are asking. Otonomo provides these in a variety of dashboards that provide clear answers to questions about predicted demand and usage. For example, the red dots in the demand map below show existing e-bike docking stations and ranks demand for bikes at those locations by usage. The blue dots laid over the existing stations highlight areas with high demand for bikes, but low supply – an incredible insight for a micromobility operator looking for the best locations to expand their service.

Existing supply and predicted demand for e-bikes
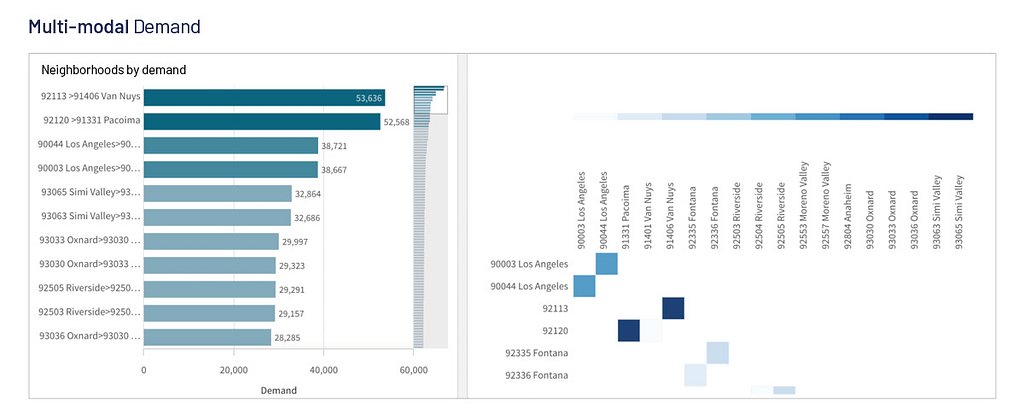
Similarly, the Origin/Destination matrix below will tell a city planner where additional bus routes might improve traffic flow in the city by highlighting which neighborhoods are in highest demand.

The future of smart mobility lies in mobility intelligence
As our cities and roads become ever-more crowded, smart, sustainable, and resilient mobility solutions are becoming critical to keeping people and goods moving from one place to another. The key to tomorrow’s mobility solutions lies in the huge volumes of data we have at our fingertips, and the tools to mine that data to extract mobility intelligence insights based on data science.
The post Mobility Intelligence – The Gold of Mobility Data appeared first on Otonomo.


