The fortunes of Americans whose wealth is in the top 10 percent have soared, leaving the rest of the country trailing in their wake. But let’s focus instead on the unsettling trends that have developed within the middle class....
The fortunes of Americans whose wealth is in the top 10 percent have soared, leaving the rest of the country trailing in their wake. But let’s focus instead on the unsettling trends that have developed within the middle class.
Both the health and finances of older workers have deteriorated in the bottom half of “the forgotten middle” over the past two decades, according to researchers at the University of Southern California and Columbia University.
Take one important indication of this. Home equity is typically an older worker’s largest single asset. But homeownership has fallen sharply in the bottom half of what the researchers define as the 60 percent of older Americans in the middle class.
The homeownership rate in the lower middle class was 79 percent in the generation born late in the Depression but slid to 54 percent for the last of the boomers born in the early 1960s. Contrast them to the upper middle class: 85 percent of the late boomers own a house.
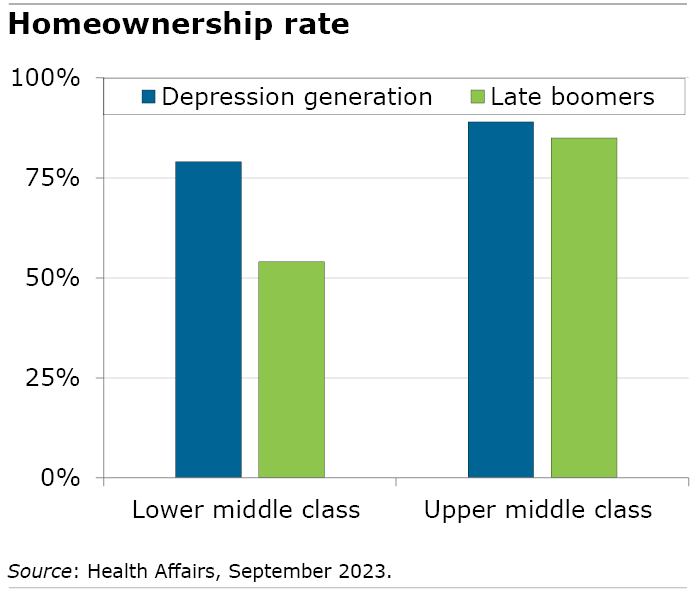
This is just one of the disparities between the top and bottom halves of the middle class that “widened substantially between 1994 and 2018,” the researchers said.
They repeated their strategy of using simple statistics for various measures of physical and socioeconomic health to track changes over time for people who were between ages 53 and 58 in five different years: 1994 (the Depression generation), 2000, 2006, 2012, and 2018 (the late boomers).
To compare the cohorts, the researchers ranked and sorted individuals in each cohort into socioeconomic subgroups based on a combination of their annual earnings and estimates of the current value of their wealth, annualized. The lower middle class is the 15th to 44th percentiles in terms of their financial resources. The 15th percentile is the federal poverty level, so the lower-middle class in this study also includes very low-paid workers. The upper middle class is the 45th to 75th percentiles.
The economic gap has widened in various ways as the lower middle class has fallen further behind. Both their earnings and the share who were employed have stagnated over the decades. The share with employer health insurance plunged from 76 percent of the Depression generation in 1996 to 46 percent of the late boomers in 2018, though many may have ended up on government-subsidized healthcare.
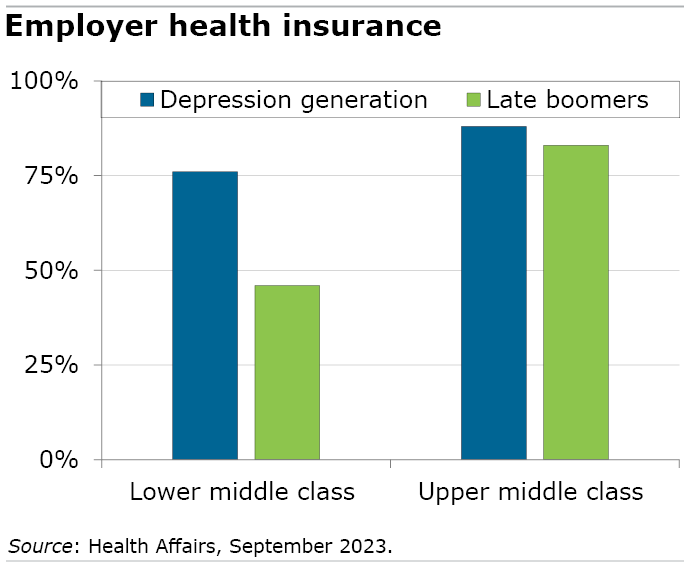
In contrast, employment in the upper middle class rose slightly, and the earnings of the late boomers in this group are 30 percent higher than the Depression generation’s earnings. Their employer health insurance rate has been both higher and stable over that time.
To be clear, the health of all 53- to 58-year-olds has deteriorated, a troubling trend that has been confirmed by earlier research. For example, the number of chronic conditions reported by both the upper- and lower-middle classes have increased, this new study found.
But the lower middle class has fared worse. One in five members in the Depression generation said they were in poor or fair health in 1994. By 2018, that had jumped to nearly one in three late boomers. In the upper middle class, the share in poor or fair health has stayed at about 10 percent of women and has risen to 17 percent of men – still well below the rate for men in the lower middle class.
Smoking, a straightforward indication of health, has fallen quite a bit over the decades in the upper middle class. The smoking rate hasn’t changed much in the lower middle class. The rate was 25 percent for women and 31 percent for men in 2018.
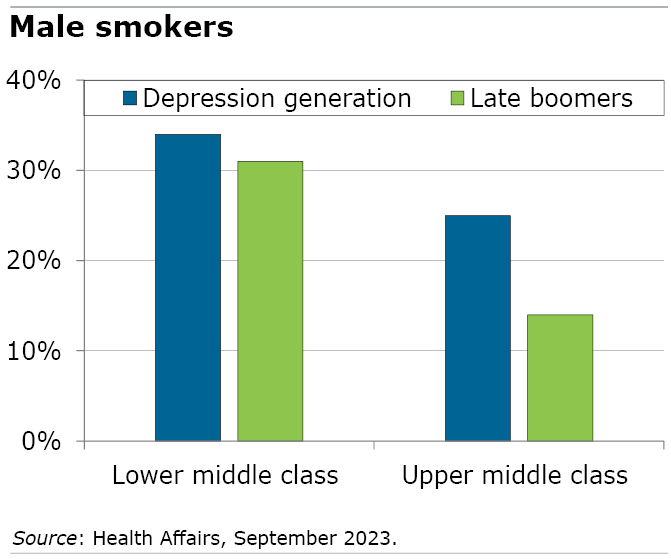
Obesity is one health statistic that runs counter to the trend. Despite the upper middle class being healthier in most ways, the obesity rates in both the upper and lower middle class have risen sharply.
But the main conclusion of the researchers is that the disadvantaged people in the bottom half of the forgotten middle are “being left behind compared to those with higher economic status, whose expected health and economic resources have grown substantially.”
Squared Away writer Kim Blanton invites you to follow us on Twitter @SquaredAwayBC. To stay current on our blog, please join our free email list. You’ll receive just one email each week – with links to the two new posts for that week – when you sign up here. This blog is supported by the Center for Retirement Research at Boston College.


