

This one is pretty cool, even by our standards.. below is our advanced betting simulation; a sports betting calculator that shows the efficacy of your betting system based on a few basic metrics. Check it out: (and scroll down...
This one is pretty cool, even by our standards.. below is our advanced betting simulation; a sports betting calculator that shows the efficacy of your betting system based on a few basic metrics.
Check it out: (and scroll down for a full explanation)
�
This is a pretty powerful Drawdown Monte Carlo Simulation Calculator for Sports Betting, so before you start plugging in numbers, let us explain why we made it and how you can use it..
Plain probabilities are often counterintuitive. What is the probability of winning by luck? Is it very bad luck to suffer a drawdown of 50 units? And 20 units? How many bets are needed to consider that the results are not affected by variance?
It is impossible to answer these questions just by intuition, not even approximately. We need to make some calculations, by using formulas or, when there is no formula available, by using Montecarlo simulations.
So we created this simple to use but powerful calculator. It is based in several excel files we have provided in a previous article here. However, with this calculator we have streamlined the whole process, just input your figures and press the button.
This tool requires some basic understanding of betting terms and relevant mathematics so below is a full breakdown of all the inputs and outputs so you can use it most efficiently.
Sports Betting Calculator � Inputs
In order to define the characteristics of our simulation, we need these simple values:
Number of bets
The number of bets �N� of a betting strategy from the beginning or during a determined period of time, depending on the analysis we are looking for.
Yield
Net profit divided by total volume. It is the percentage of net profit of the total amount bet. In the long term, the real yield achieved should tend to the expected yield. A skilled bettor should have a positive expected yield in the long term, although in a short series of bets, it could be losing.
![]()
Average weighted odds
No one bets always at the same odds, but using this parameter, the results of the simulations are approximate enough. It is the result of multiplying each bet odds by the stake, and dividing the result by the total amount bet.
The average weighted odds can also be calculated from the Yield(%) and Hitrate(%), with the following formulas:

Average bet size
As its name states, it is the average amount placed in each bet. I can be calculated as the total volume bet divided by the number of bets. It can be expressed as units of stake, currency or percentage of the bankroll, but I always recommend to use the equivalency of 1 unit = 1% of the bankroll, so that it is easy to know how many times we have bet our bankroll (rollover), how much is the profit compared to the initial bankroll or how big is the drawdown.
![]()
Now we need three more parameters for the Montecarlo simulations and define some results we want to obtain:
Number of Montecarlo simulations
How many times are we simulating a series or number of bets? The higher the number of simulations, the more precise results we are obtaining, but it will take some more time (although the calculations are very simple and it will take just few seconds). With 1000 simulations of 1000 bets, we are reproducing 1 million bets in a blink of an eye.
Probability of obtaining a drawdown greater than X
X is in the same units as the average bet size. In fact, the maximum drawdown is proportional to the bet size. If we want to know what the probability of losing half your bankroll, and the bet size is expressed in units with 1 unit = 1% of the bankroll, and we maintain the bet size during the bad streak, we should take X equal to 50 units. We would normally stop betting or reduce our bet size before reaching that big loss, but by calculating the probability of a maximum drawdown of half bankroll, we can compare the risk for different values of number of bets, yield, average weighted odds and bet size, and take decisions to adapt the risk to our risk tolerance profile.
Probability of obtaining a yield greater than Y
Variance affects the results after our number of bets. If the odds are constant and we assume that the long term yield is also constant during those bets, we can calculate the probability of each possible number of won and lost bets with the binomial distribution, and therefore, the yield distribution. What is the probability of obtaining a yield that doubles the long term yield in a short series of bets? We can use this calculator to determine the exact value.
Intermediate results
After defining the inputs, we can obtain some intermediate results directly:
Expected profit
It is simply the average profit we would expect, and it is calculated as the number of bets multiplied by the yield and the average bet size.
![]()
Hitrate
The percentage of successful bets depends on the average weighted odds and the long term yield.

Average profit per bet
Any value above 0.1 units is a very good result. Winning 0.1% of your bankroll after each bet on average, with a sufficiently high number of bets will make you rich (if the risk is low enough  ).
).
![]()
Yield standard deviation
The yield obtained follows a normal distribution around the long term yield. Approximately 68% of the times, the yield will be between the long term yield plus/minus one standard deviation, and 95% of the times, between the long term yield plus/minus two standard deviations. For constant odds and yield, and bet size = 1, it can be calculated as follows:

t-value
Also known as t-score, the t-value is equivalent to the number of standard deviations away from the mean of the t-distribution. The t-value is the test statistic used in t-tests and regression tests. It can also be used to describe how far from the mean an observation is when the data follow a t-distribution.
![]()
Probability of Luck vs Skill
Is a positive result the consequence of luck or it is very probable that it is the result of skill? We can never know the answer 100%, but we can estimate it, or at least compare different results with the p-value. This subject and the maximum drawdown have also been explained here. With the betting system simulation tool we are calculating these two metrics:
p-value
The p-value is a statistical test to estimate the probability that the null hypothesis is true. In this case, the null hypothesis is that we have no skill (yield = 0%). The p-value is then the probability of obtaining a yield greater than the defined yield if we have no skill. If this probability is small enough, then we can reject the null hypothesis. How small? A value below 5% is commonly considered a low enough value, but as there are thousands of strategies, tipsters and systems, a value below 0.1% would be safer.
The calculations behind this are based on the formulas proposed by Joseph Buchdahl (@12xpert) in his article �Luck vs Skill in Sports Betting�.
1-in-X
Is simply the inverse of the p-value. It means how many times on average we should bet with the inputs defined in order to obtain such yield just by luck.
Maximum drawdown
If you have found a positive expected value method, the higher bet size, the higher profit you will obtain� but it will also enlarge your risk. The profit and the drawdown are both proportional to the bet size, if we reduce the average bet size by half, both profit and maximum drawdown will be reduced in the same proportion.
It is VERY IMPORTANT to know what risk we are exposing ourselves to, in order to reduce the probability of bankruptcy to a low enough value.
Expected maximum drawdown (EMDD)
It is the average drawdown we will measure after a number of bets. It is a measure of the risk of the method, and values below 30 units are advised. If you get higher values, you can reduce the bet size to a lower value until this recommendation is achieved. In case of a constant value of average profit per bet and standard deviation of the yield, a formula based on the brownian motion with drift and barrier can be used, as it is described in this article. The advantage of this formula is that the expected drawdown is calculated very fast, no Montecarlo simulations are required. The disadvantages are that only the average can be calculated, but not the distribution of drawdown, and also the value is approximated, as the bets are discrete �movements� of the profit, while the formula is based on continuous distribution of profits, but as we will see, results are very similar to those obtained with Montecarlo simulations.
Montecarlo average maximum drawdown (XMDD)
It is the same value, but calculated after all the Montecarlo simulations. Its value is more accurate than the EMDD, but the time required for its calculation is higher. Additionally, as you can check, the value obtained varies after executing all the simulations because the Montecarlo procedure has some variability due to the fact that random numbers are used to simulate each series of bets.
Montecarlo median maximum drawdown
With the Montecarlo simulations, we can calculate the maximum drawdown that has 50% probability of being exceeded. As the distribution of the maximum drawdown is not symmetric, the median maximum drawdown is always lower than the average maximum drawdown.
Probability of maximum drawdown >X
We can better measure the risk of a series of bets by calculating the probability of a maximum drawdown greater than a certain amount X. As a reference value to compare different methods, we suggest the probability of a maximum drawdown greater than 50 units. This value should be very low, for example lower than 1% of the number of bets placed in one year.
We can estimate and compare the risk of any method by using the expected or average maximum drawdown, or the probability of drawdown higher than a defined value. It can be demonstrated that there is a direct relationship between the expected maximum drawdown and the sharpe ratio (?/?), as it is described in this article.
We can also check if the real series of bets has been lucky or not, depending on the real maximum drawdown obtained. A very low real maximum drawdown when compared to the expected maximum drawdown can also make us suspect that the history has been �prepared� or altered. You can also estimate the probability of such a small MDD with this betting results simulation tool.
Yield distribution
We can estimate the yield distribution with the yield standard deviation approximation, but it is also possible to use the binomial distribution to calculate the probabilities of different combinations of successful and lost bets.

Probability of yield greater than Y
With the previous formula, we can calculate exactly the probability of obtaining a yield greater than a certain amount �Y�. If we set Y to 0, we will obtain the probability of winning. Of course, the probability of losing will be 100 minus the probability of winning. For a positive expected value method, the higher yield, number of bets, and lower odds, the higher probability of winning in the end.
Profit/Risk Ratio
When putting our money at risk, we do not only want to increase the profit, but also have a low risk in order to avoid bankruptcy with a high enough probability. We can compare between methods by using this ratio:
Profit / EMDD
It is the ratio between the expected profit and the expected maximum drawdown. This value does not depend on the bet size, as both numerator and denominator values are proportional to the average bet size.
Profit / XMDD
The same value but calculated with the Montecarlo simulations
A good way to compare different methods, is comparing the Profit / EMDD ratio for bets placed during the same period of time, for example, one year. Values higher than 5 are very good methods.
Single Simulation
We have included a graph with a single simulation of bets. Each time you click on the �Calculate� button, we are reproducing the number of bets, yield, odds and bet size and plotting them. You can check that, for the same parameters, the resulting profit, the maximum drawdown and the curve during the series of bets can have very different shapes.
For example, this is an example of a result close to the average, and a maximum drawdown close to the expected value, for the default values of the calculator (N=1000, Yield=5%, Odds=2, Bet size=1):
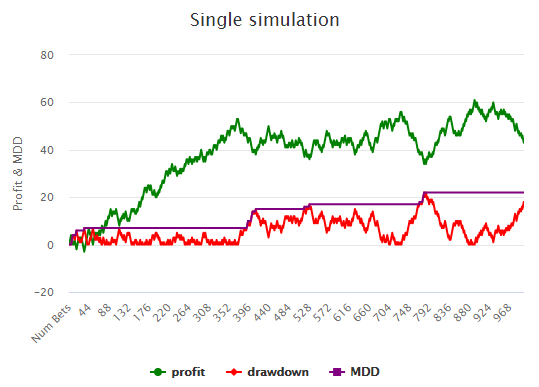
As you can see, the profit is around 50 units, and the maximum drawdown is around 22 units. But observe that the 50 units of profit were obtained after the first 350 bets (a good and lucky start) and after that, the profit has been more or less horizontal, with a maximum drawdown after 800 bets.
Each time the red line of the current drawdown �touches� the barrier of 0, it means that the profit has reached a new maximum value.
Are you able to obtain a plot that doubles the expected profit (Y=10)? And a plot with a negative result (Y=0)? The probabilities are 5.31% and (100-93.95)=6.05% respectively.
Maximum Drawdown Distribution
Each time you click on the �Calculate� button, the number of Montecarlo simulations are executed. If we count how many times we obtain each maximum drawdown, we can plot the maximum drawdown distribution. As you can see, it is not symmetrical and the probability of suffering a maximum drawdown two or even three times the expected maximum drawdown is not zero at all.

The higher number of Montecarlo simulations, the more accurate this distribution will be, but the number of calculations and computing time increases.
Are you able to obtain a plot with values of maximum drawdown higher than 4 times the expected maximum drawdown? (Clue: if you increase the number of simulations, the probability of a higher maximum drawdown also increases).
Some Examples
We start with the default values (N=1000, Yield=5%, Odds=2, Bet size=1, number of simulations = 1000, X= 50 and Y=0). We can observe the sensitivity of the EMDD and p-value for different yields, number of bets and odds by changing them one by one.
Number of bets  |
p-value  EMDD
probability of yield > 0 (only if it is an EV+ method)
EMDD
probability of yield > 0 (only if it is an EV+ method) |
|
Yield |
p-value
EMDD
probability of yield > 0 |
|
Odds |
p-value
EMDD
probability of yield > 0 |
|
Bet size |
p-value  EMDD
probability of yield > 0
EMDD
probability of yield > 0 |
In the following table, we can see some examples obtained by changing only one parameter with respect to the default values:
Advanced Calculator (changing only one parameter)
| Parameter� /�result | Default� values | Example� 1 | Example� 2 | Example� 3 | Example� 4 |
| Number� of�bets | 1000 | 2000 | 1000 | 1000 | 1000 |
| Yield | 5 | 5 | 10 | 5 | 5 |
| Odds | 2 | 2 | 2 | 3 | 2 |
| Bet�size | 1 | 1 | 1 | 1 | 2 |
| p-value | 5.69% | 1.26% | 0.076% | 13.47% | 5.69% |
| EMDD | 25.11 | 30.98 | 18.43 | 40.2 | 50.22 |
| probability of yield� >�0 | 93.95% | 98.66% | 99.92% | 86.32% | 93.95% |
Which one is the best situation? Of course, it is the example 2, with a yield of 10%. We get more profit for a lower risk. Additionally, as the EMDD is 18.43, we could increase the bet size a little bit until an EMDD of 25-30, in order to obtain higher profit for a reasonable risk.
What happens if we test different combinations? If you have 2 methods with yield 5% for Odds=2 and yield 6% for Odds = 3 and the same number of bets and bet size, which method would be better? (Clue: Compare the Profit / EMDD)
We can also calculate the p-value with the probability of yield greater than Y. For example, the p-value for the default values of the parameters, is 5.69%. This means that if the yield was 0 (no skill), we still would have a probability of 5.69% of obtaining a yield greater than 5%. We can calculate the same with the binomial distribution. If we set the yield to 0% and Y=5%, then we are also calculating the probability of obtaining a yield greater than 5%, and the value obtained is 5.34%. The difference is due to the approximation we make on the yield standard deviation formula.
Drawdown Monte Carlo Simulation Calculator for Sports Betting Code
Code of the simulation tool in javascript:
You can see the code of this article web page to find the code of the functions we have used for all the calculations. If you use it, please cite The Value Betting blog and this URL.
Or you can directly write us to contact@winnerodds.com and ask for it!
Please let us know in the comments below if you found this helpful, if you have any questions or future calculator requests don�t hesitate to ask about that as well!
Happy (Value) Betting