LONG TERM1 unit bought at 22451$ SHORT TERMNo position open As someone who is interested in long-term investments, I recently made the decision to buy bitcoin at a price of 22451$. I will explain the reasons that led me...
LONG TERM
1 unit bought at 22451$
SHORT TERM
No position open
As someone who is interested in long-term investments, I recently made the decision to buy bitcoin at a price of 22451$. I will explain the reasons that led me to make this decision.
The first reason is based on technical analysis. An oscillator indicator, which measures momentum, has recently given a bullish signal on the monthly chart of bitcoin. This is a strong signal indicating that the price of bitcoin is likely to continue rising in the coming months like it did in 2015 and 2019, this oscillator is a modified version of the classic RSI indicator.
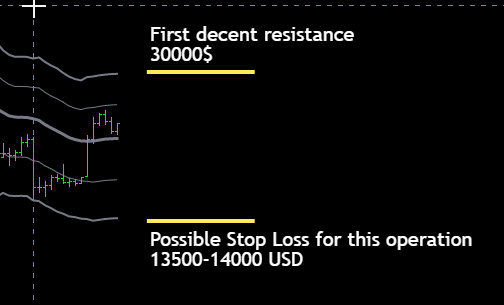
The second reason is related to price action analysis. After testing the first resistance of the weekly chart, the price of bitcoin has retreated to the weekly moving average, which has provided strong support. This is a positive sign, and it suggests that the price of bitcoin is likely to continue its upward trend and should reach the $30,000 mark.
The third reason for my decision to invest in bitcoin is based on a longer-term trend analysis. It has been enough time since the top of 2021 to justify a period of consolidation, with a low point slightly above $15,000. This bottom is still quite high compared to the one of 2019, confirming that the overall trend of bitcoin is still strongly upward.
In conclusion, my decision to buy bitcoin at a price of 22451$ is based on a combination of technical analysis, price action analysis, and long-term trend analysis.
Stop loss is wide as usual for long term trades, support is the 2nd price band on weekly chart, if the price of Bitcoin falls below $14,000, I may need to reconsider my position and potentially exit the trade.
On the upside, the first significant resistance level is at $30,000. This means that if Bitcoin is able to break through this level, there could be significant upside potential for the trade, breaking through the $30,000 resistance level could potentially set Bitcoin up for a bullish trend towards the yearly forecasted resistance level of $58,000, which was predicted back in January in my yearly forecast.
More info in the upcoming updates.
 Weekly Chart BTCUSD with KAMA average and price deviation bands, price is holding above the Kama average now at 21000$


